Tired of Bad News? Good News Never Gets Old!
Got good story for us? send - [email protected]

“For every minute you remain angry, you give up sixty seconds of peace of mind.” ― Ralph Waldo Emerson
Uber survey highlights driver happiness, ignores earnings
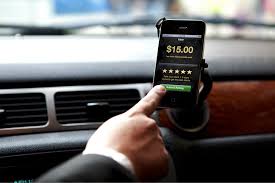
Uber released a survey Monday showing that its U.S. drivers — now numbering over 400,000 — value flexibility and enjoy their work. But the survey seemed as notable for what it omitted, such as driver earnings, as what it included.
While the survey looked at drivers’ attitudes and demographics, it sidestepped hot-button topics such as actual earnings and how many drivers work full time through the ride-hailing company. Many of the results echoed arguments Uber has made in court cases involving drivers seeking to be reclassified as employees. They also buttress Uber’s claim that it helps boost income for people who are between jobs or struggling to pay bills, something Uber board member and chief adviser David Plouffe has been discussing in speeches.
“Uber provides an option and an opportunity to hundreds of thousands of Americans that wasn’t there before,” said Joel Benenson, CEO of the company that did the survey, in a statement. “It’s clear from the data that drivers place immense value on the flexibility Uber gives them to go to school, earn extra income, be with their families and do other things with some extra money in their pockets.”
Creating a platform for people to make money driving their own cars for hire has paid off big time for Uber, a 6-year-old company whose valuation last week vaulted to a stunning $62.5 billion, eclipsing Ford Motor Co., General Motors and Time Warner. If Uber drivers were employees, its U.S. workforce would roughly equal that of McDonald’s, which has 420,000 full-time and part-time employees. The fast food giant’s market capitalization is $106.6 billion.
Some 81 percent of surveyed drivers said they are satisfied or very satisfied about driving for Uber, while 97 percent expressed satisfaction with the flexibility, Uber said.
“Folks choose to drive for Uber because of that flexibility element and that control over their own schedules,” said an Uber spokesman. “Different drivers use it in different ways.”
Research firm Benenson Strategy Group interviewed 833 drivers in 24 large cities, including San Francisco, in November. Benenson did similar interviews with 601 drivers in December 2014, which Uber released in January as part of a report co-authored by Princeton economist Alan Krueger. This year, Uber simply released selected data without producing a report. In both cases, the respondents were representative of Uber’s overall driver contingent, it said, with UberX “citizen drivers” vastly outnumbering Uber Black limousine drivers.
Last year’s report examined driver earnings — saying that San Francisco drivers earn $23 an hour, for instance — but was widely criticized for omitting expenses such as gasoline and car maintenance that would erode those figures.
Both years’ surveys examined whether drivers work elsewhere besides Uber. Being solely dependent on a company for income is one determinant of being an employee. Sixty-nine percent of drivers, up from 62 percent last year, said they do other work besides driving for Uber. A fifth of drivers said Uber was their only source of income, while a third said it was a major income source, and 48 percent said it was supplemental income.
Eighty-eight percent said they drove with Uber “because it fit their life well, not because it was their only option,” the survey results said.
“One of the big hallmarks of flexibility is drivers’ ability to earn money with us and with their other jobs,” said an Uber spokesman.
Exactly half of respondents were just occasional drivers, averaging less than 10 hours a week behind the wheel, Uber said. However, it didn’t look at the other end of the spectrum: how many drivers work 40 hours or more a week, which might lead one to consider them full-time workers.
An increasing number of women drive for Uber — 19 percent of respondents were female, compared with 14 percent last year. That seems to be accelerating, Uber said, because 29 percent of new drivers in the past three months are women.
Eleven percent are students, almost double the 6 percent of students in the general population.
Another shift is among those new to professional driving. Two-thirds (67 percent) of respondents this year said they’d never previously earned money from driving, up from 51 percent a year ago.
Uber’s drivers “continue to be a majority minority group,” Uber said. Whites account for 40 percent of drivers, while blacks are 24 percent, Hispanics are 20 percent, Asians are 13 percent and other backgrounds are 6 percent. (The survey accepted multiple answers, so results add up to more than 100 percent.)
Drivers’ ages were evenly distributed across the spectrum, with anywhere from 23 to 30 percent falling in all of these categories: 21 to 29, 30 to 39, 40 to 49 and 50 plus.
“Folks are seeing (Uber) as something they can use when they need it,” an Uber spokesman said. “It doesn’t necessarily need to become a permanent activity or source of income. When they need it to make money, it’s there.”
Carolyn Said is a San Francisco Chronicle staff writer. E-mail: [email protected] Twitter: @csaid
Uber survey
Do drivers have other jobs? The numbers changed from last year
2015
2014
Uber is only source of income
20%
24%
Uber is major source of income
33%
39%
Uber is supplemental source of income
48%
38%
The number of female drivers is growing
2015
2014
Female drivers
19%
14%
Male drivers
81%
86%
Drivers are spread across the age spectrum
21-29
23%
30-39
30%
40-49
24%
50-plus
23%
Drivers constitute a majority minority group
White/Caucasian-only
40%
Black/African American
24%
Hispanic/Latino
20%
Asian or Pacific Islander
13%
Other ethnic background
6%
Recent Comments